

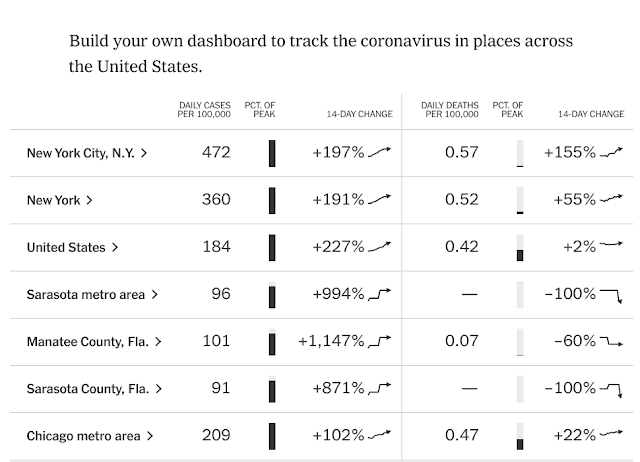
Coronavirus in the U.S.: Latest Map and Case Count
(Red and Orage - Bad)
By The New York TimesUpdated July 19, 2020, 2:56 P.M. E.T.
TOTAL CASES
3.7 million+
DEATHS
140,262
140,262
Includes confirmed and probable cases where available
"More than 3,763,600 people in the United States have been infected with the coronavirus and at least 140,200 have died, according to a New York Times database. This map shows where the number of new cases is rising and where it is falling in the last 14 days.
The Times’s data collection for this page is based on reports from state and local health agencies, a process that is unchanged by the Trump administration’s new requirement that hospitals bypass the Centers for Disease Control and Prevention and send all patient information to a central database in Washington.
We have updated the hot spots map below to show cases per capita for the last week to better reveal current hot spots. The map previously showed the rate of change in cases.
Case numbers are surging throughout most of the United States, including in many states that were among the first to reopen. Because the number of people hospitalized and the percentage of people testing positive is also rising in many of those places, the case spike cannot be solely explained by increased testing. Still, coronavirus deaths remain well below their peak levels. And as some places reimpose restrictions, others continue to reopen their economies."
Click to read more


No comments:
Post a Comment