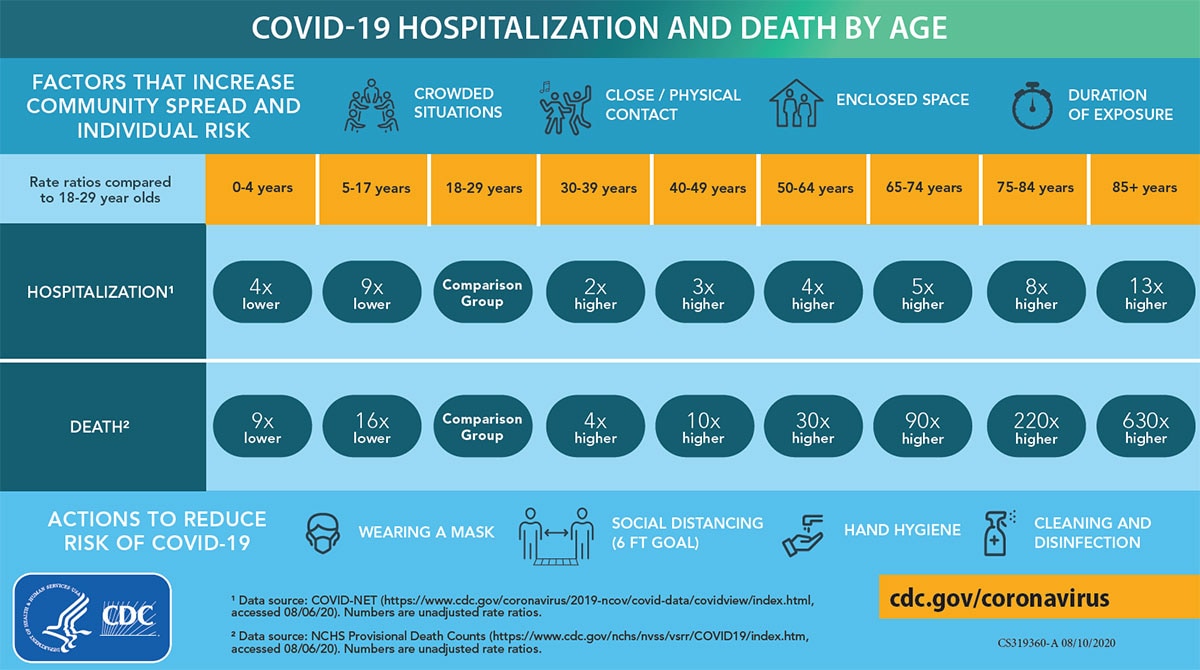
COVID-19 Hospitalization and Death by Age
Rate ratios compared to 18-29 year olds
| Hospitalization1 | Death2 | |
|---|---|---|
| 0-4 years | 4x lower | 9x lower |
| 5-17 years | 9x lower | 16x lower |
| 18-29 years | Comparison Group | Comparison Group |
| 30-39 years | 2x higher | 4x higher |
| 40-49 years | 3x higher | 10x higher |
| 50-64 years | 4x higher | 30x higher |
| 65-74 years | 5x higher | 90x higher |
| 75-84 years | 8x higher | 220x higher |
| 85+ years | 13x higher | 630x higher |
Factors that increase community spread and individual risk
Crowded Situations
Close/physical contact
Enclosed space
Duration of exposure
Actions to reduce risk of COVID–19
Wearing a mask
Social distancing
(6 ft goal)
(6 ft goal)
Hand hygiene
Cleaning and disinfecting
1 Data source: COVID-NET (https://www.cdc.gov/coronavirus/2019-ncov/covid-data/covidview/index.html, accessed 08/06/20). Numbers are unadjusted rate ratios.
2 Data source: NCHS Provisional Death Counts (https://www.cdc.gov/nchs/nvss/vsrr/COVID19/index.htm, accessed 08/06/20). Numbers are unadjusted rate ratios.

View Page In: PDF [74K]


No comments:
Post a Comment